View graphs over vehicle speed and engine speed in your Reports
2023-06-19
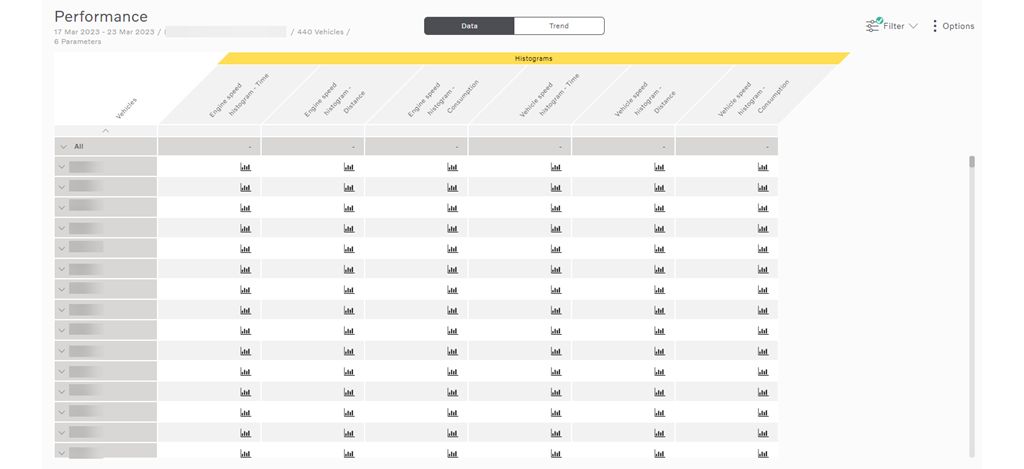
You can now view detailed information about your vehicles’ speed and engine speed (RPM) within the Report tool. The graphs plot engine speed and vehicle speed over time, distance and consumption in separate bar graphs. The views can be used to analyze engine speed for vehicles servicing specific routes and see if they are suited for their task.